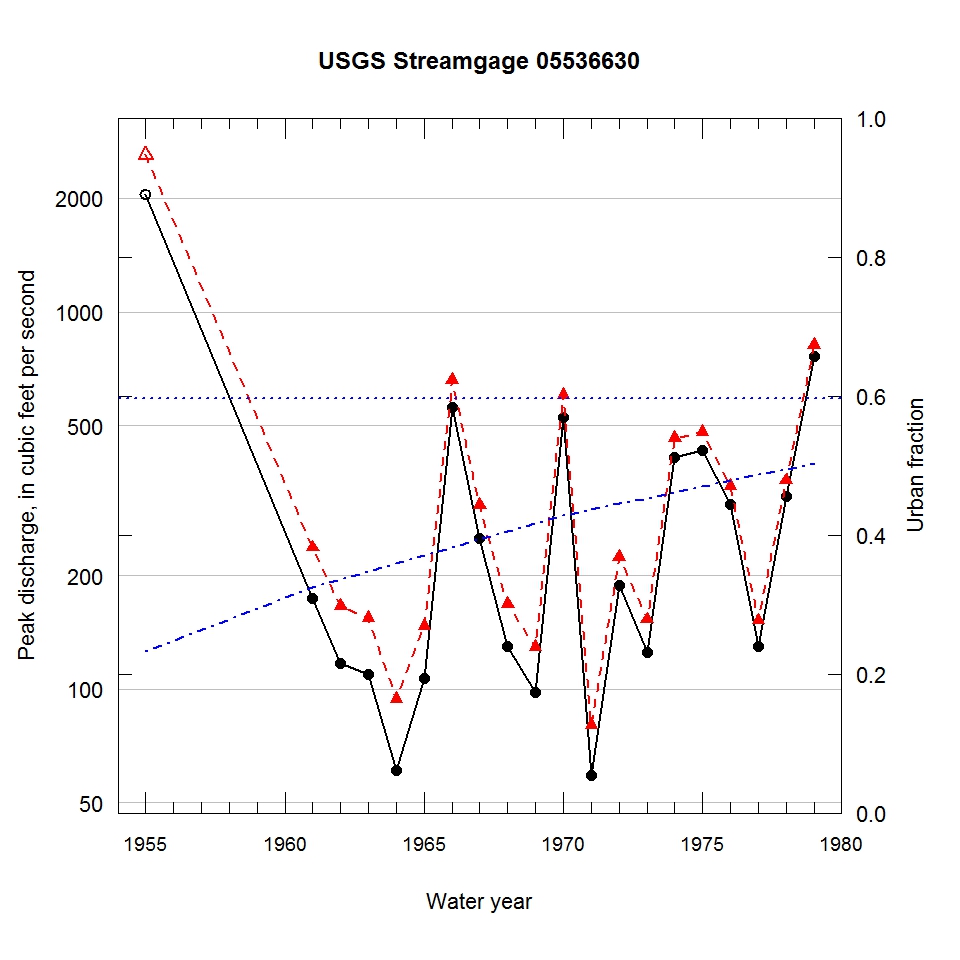
Observed and urbanization-adjusted annual maximum peak discharge and associated urban fraction and precipitation values at USGS streamgage:
05536630 MILL CREEK AT PALOS PARK, IL


| Water year | Segment | Discharge code | Cumulative reservoir storage (acre-feet) | Urban fraction | Precipitation (inches) | Observed peak discharge (ft3/s) | Adjusted peak discharge (ft3/s) | Exceedance probability |
| 1955 | 1 | 7 | 0 | 0.233 | 3.301 | 2050 | 2610 | 0.000 |
| 1961 | 1 | 2 | 143 | 0.324 | 1.419 | 174 | 237 | 0.518 |
| 1962 | 1 | 2 | 143 | 0.336 | 0.282 | 117 | 166 | 0.782 |
| 1963 | 1 | 2 | 143 | 0.347 | 1.533 | 109 | 154 | 0.820 |
| 1964 | 1 | -- | 143 | 0.359 | 0.736 | 61 | 94 | 0.954 |
| 1965 | 1 | 2 | 143 | 0.371 | 0.885 | 107 | 147 | 0.840 |
| 1966 | 1 | -- | 143 | 0.382 | 1.425 | 558 | 659 | 0.024 |
| 1967 | 1 | 2 | 143 | 0.394 | 1.153 | 251 | 307 | 0.290 |
| 1968 | 1 | -- | 143 | 0.405 | 1.421 | 130 | 168 | 0.776 |
| 1969 | 1 | 2 | 143 | 0.417 | 0.407 | 98 | 129 | 0.892 |
| 1970 | 1 | -- | 143 | 0.429 | 1.092 | 526 | 603 | 0.033 |
| 1971 | 1 | 2 | 143 | 0.437 | 0.902 | 59 | 80 | 0.968 |
| 1972 | 1 | -- | 143 | 0.445 | 1.212 | 188 | 224 | 0.568 |
| 1973 | 1 | -- | 143 | 0.453 | 1.344 | 125 | 153 | 0.825 |
| 1974 | 1 | -- | 143 | 0.462 | 1.139 | 411 | 463 | 0.080 |
| 1975 | 1 | -- | 143 | 0.470 | 1.075 | 429 | 480 | 0.071 |
| 1976 | 1 | -- | 143 | 0.478 | 0.986 | 309 | 345 | 0.205 |
| 1977 | 1 | -- | 143 | 0.486 | 1.448 | 130 | 152 | 0.827 |
| 1978 | 1 | -- | 143 | 0.495 | 1.076 | 325 | 357 | 0.188 |
| 1979 | 1 | -- | 143 | 0.503 | 0.862 | 762 | 817 | 0.014 |

